Diabetes Integrated Care using modern Continuous Glucose Monitoring (CGM)
QuickCure’s team of doctor, care coordinators, and health technicians, executed the CGM 14-day program for enrolled patients utilizing the FreeStyle Libre flash glucose monitoring system. This article delves into the process of reviewing and analyzing the Ambulatory Glucose Profile (AGP) reports generated by the Continuous Glucose Monitoring (CGM) system and how the information can be used to integrate into the holistic management of diabetes
Decoding the Waveform: A Guide to its Key Features
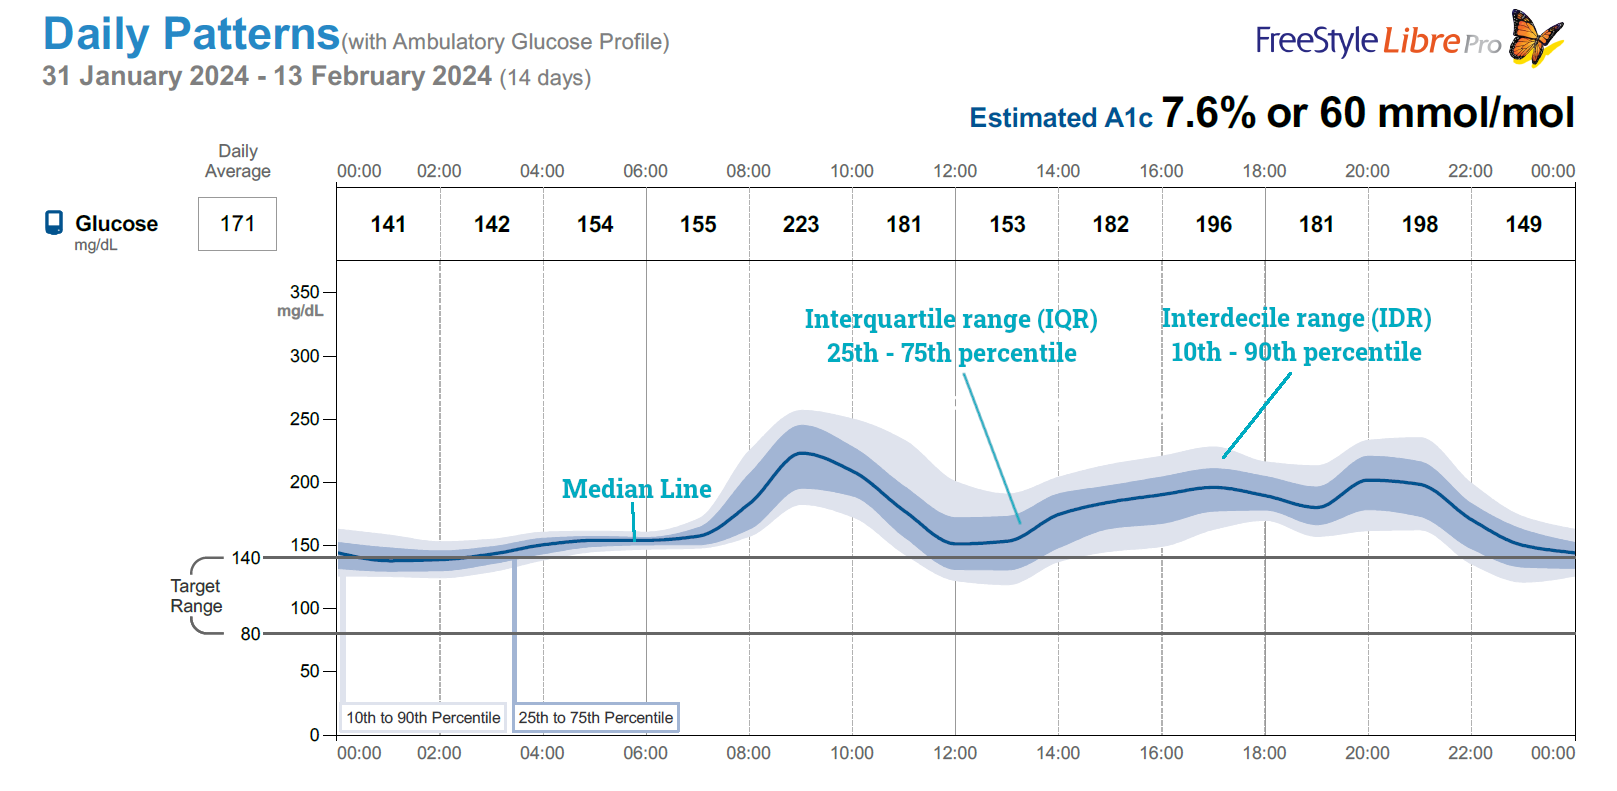
From the report generated by the FreeStyle Libre Pro flash glucose monitoring sytem, we try to understand how each facet of the AGP aids in comprehending daily patterns in glucose control for individuals with diabetes. This includes the patterns of hypoglycaemia, hyperglycaemia as well as glycaemic variability.

A Look at Four Essential Visual Cues
Four Essential Visual Cues
Median line: It illustrates the mean glucose level at various times throughout the day, offering a graphical representation of whether the average glucose falls within the desired range and the extent of fluctuations over the course of the day.
Interquartile Range (IQR): The blue shaded area, also known as the interquartile range (IQR), represents the middle 50% of all glucose readings. This band spans from the 25th percentile to the 75th percentile of the glucose readings. This band captures the day-to-day variability in glucose levels, specifically those readings closest to the average (median).the IQR band acts like a window showcasing the typical day-to-day pattern of glucose levels, with narrower windows indicating better control achieved through medication and mealtime management.
Interdecile Range (IDR): The grey shaded area represents the interdecile range (IDR), encompassing the 10th to 90th percentiles of the data. This band captures the values that fall outside the “typical” range (middle 50%) and reflect less frequent deviations from the daily average glucose level.
Target Range: Most of the glucose readings should fall within this range
Integrated Care Diabetes Management Approach
Hypoglycaemia: The cornerstone of optimal diabetes management lies in reducing both the frequency of hypoglycemic episodes and the associated overall risk, aligning with global guidelines advocating for a time spent below the target range of less than 4% as a general recommendation, and even more stringent standards, aiming for less than 1%, for those deemed at high risk.
Hyperglycaemia: The second stage in any AGP assessment then focuses on hyperglycemia, as persistently high blood sugar levels lead to complications. Research shows that reducing hyperglycemia, reflected by HbA1c levels, significantly lowers the risk of both microvascular and macrovascular diseases in the long term.
Glucose variability: The third phase of assessment involves examining glycemic variability. The importance of glycemic variability as a risk factor for cardiovascular complications in diabetes is becoming more evident, regardless of sustained hyperglycemia or long-term HbA1c levels.
Target Range: In an AGP review, a key aspect is evaluating time spent within the target range. The goal being to maximize the percentage of time a patient’s blood sugar stays within this ideal zone for optimal glycemic control.
Individualized Diabetes Care: Using AGP Analysis to Refine CGM Therapy
AGP analysis plays a crucial role in diabetes management programs with care coordinators for several reasons. Firstly, by providing a detailed picture of a patient’s blood sugar fluctuations throughout the day, AGPs allow care coordinators to identify patterns and pinpoint potential problems like hypoglycemia or hyperglycemia. This early detection allows for targeted interventions, such as medication adjustments or dietary modifications.
Secondly, AGP analysis helps care coordinators assess the effectiveness of current treatment plans. By monitoring how a patient responds to their medication or lifestyle changes, care coordinators can personalize and optimize the management strategy for better long-term control.
Finally, AGP data empowers both care coordinators and patients. The visual representation of blood sugar levels fosters a deeper understanding of the disease and motivates patients to make informed decisions regarding diet, exercise, and medication adherence, ultimately promoting overall well-being.
Stay informed, stay healthy!
Paras Jasani
paras@quickcure.in


